- Correlation
- Correlation is the measured strength of cohesion between two continuous variables. The computed strength has the minimum value -1, and the maximum value is +1.
- The origin of correlation
- Formulas to compute the correlation coefficient
- How to interprete the correlation coefficient
- Testing the correlation coefficient
- Final remarks about correlation
- Related topics to correlation
- Manuals that help you to significantly improve your research:
- Mission
Correlation
Correlation is the measured strength of cohesion between two continuous variables. The computed strength has the minimum value -1, and the maximum value is +1.
The origin of correlation
Sometimes things look very obvious. Students with a higher motivation, tend to have better results. People who earn more live in a bigger house. Bigger animals have a slower heartbeat. The closer to the equator, the hotter the earth will be. These are all nice ideas, but are they really true?
In order to figure out any relationship, it is good to visualize the relationship first. Making a scatterplot like the one below can do this. For simplicity only ten objects (dots) are used. This plot makes clear that if the value on the x-as increases, the value on the y-as increases as well. It is not a one-on-one relationship, but there sure is a positive relationship.

Formulas to compute the correlation coefficient
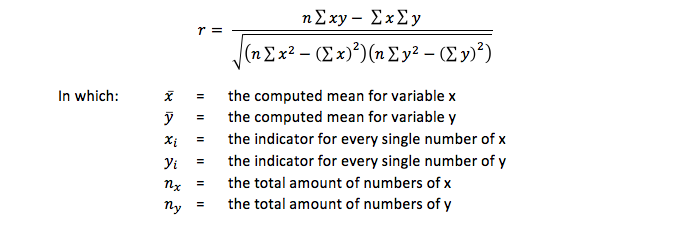
The strength of the relationship can be computed by two formulas:

or

In both formulas an r is computed. This r is known as the product moment correlation coefficient of Pearson, or shorter: the correlation coefficient.
Both formulas look quite different, but computations with the same data have the same result. Besides that - how remarkable - the minimum is -1 and the maximum is +1. These values can only be reached when there is a perfect relationship. If there is no relationship at all, the outcome is 0. In a scatterplot it looks like the ones below.
How to interprete the correlation coefficient
A positive correlation coefficient indicates a positive relationship: if the value on the x-as increases the value of the y-as increases. The dots are in a straight line. The computed r = 1.

A negative correlation coefficient indicates a negative relationship: if the value on the x-as increases the value of the y-as decreases. The dots are in a straight line. The computed r = -1.

And if there is no relation at all, the dots seem to be scattered all over the place. Now the computed r is 0 (and sometimes it looks like a zero too).

The above outcomes are curiosities. Almost always the scatterplot looks something like a cigar. Some cigars are very thin (and then r is close to 1 or -1) and some cigars are very thick (maybe it is better to speak of a rugby football).
Testing the correlation coefficient
To test if the relation between to variables is statistically significant, this formula is used:

This formula is testing if r is unequal to 0. Testing can be done as two-sided or as one sided. Read our manual for more information about the statistical test procedure.
Final remarks about correlation
Correlation is the basics of statistics. It is computing the covariance between variables. The extensions of the correlation are multiple correlation and (multiple) regression. Basically also for t-tests and analyses of variance because these types of analysis are special forms of regression analysis.
Always be aware that it is a mathematical outcome. A correlation coefficient can be computed between any combinations of numbers. Therefore:
- If a correlation coefficient is statistically significant, it does not proof the theory is true. However the opposite is true: if a theoretical relation exists, it must be supported by a (statistically significant) correlation coefficient.
- If the coefficient is not statistically significant when expected it would be, it does not support the theory (which of course doesn’t mean that the theory is not correct).
- No causality in the relationship between the variables can be stated. Causality is based on a theory and not based on computation.
- Some relationships between two variables are clear, but some might be spurious.
The given formulas for computing the correlation coefficient can only be applied to variables with continuous data, that is on interval or ratio data. If the data or ordinal, the Spearman rank correlation or Kendall’s tau should be computed.
How to computes correlations and how to make an APA-proof correlation table is clearly explained in our SPSS-tutorials.
Related topics to correlation
- Spearman rank correlation
- Kendall’s tau
- Cramers V
- Multiple Correlation
- Regression
- t-value
- Spurious relations
- Variable
Manuals that help you to significantly improve your research:
- How to find the correct statistical test
- The statistical test procedure
- How to present statistical results


