Regression analysis
Regression analysis is a technique to derive an equation to predict outcomes based on one or a list of variables. It can be used to select the best predictors.
Regression analysis is an extension of correlation. An easy hypothesis is this one: Students with a higher motivation, tend to have better results. When trying to figure out this relationship, it is good to visualize the relationship first by making a scatterplot like the one below. For simplicity only ten objects (dots) are used. This plot makes clear that if the value on the x-as increases, the value on the y-as increases too. It is not a one-on-one relationship, but there sure is a positive relationship:

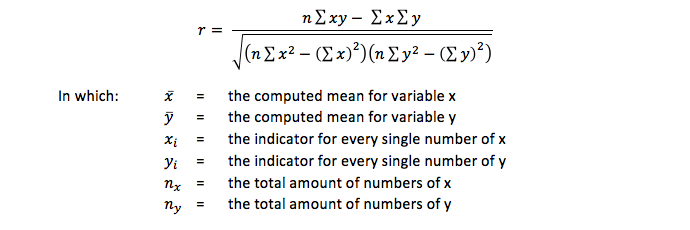
The strength of the relationship can be computed with this formula:

This r is known as the product moment correlation coefficient of Pearson, or in short: the correlation coefficient.
As you can see, an increase on the x-as (the independent variable) goes together with an increase on the y-as (the dependent variable). Now you might wonder if a line can be drawn that predicts the value on y based on the value of x?
To find this line, regression analysis is used. Any line can be drawn through these dots, but we are looking for the best fitting line. The best fitting line is the line of which the distance of all dots to the line is minimal. When calculating the distance of every dot from the line, some calculations will give an overestimation and others an underestimation. However, summing up these estimations the result would be zero. To in order to prevent the summation will be zero, the values are squared before they are summed. Therefore this technique is called the ordinary least square regression, in short OLS regression.
Calculation the regression line
On high school (or similar schools in other countries) you probably learned to derive a line based on two dots in a coordinate system. This line has the formula:

But now we have so many dots, we have to take all dots into account. To calculate b this formula is used:

b is the regression coefficient we are looking for. If b is zero the line runs flat, meaning there is no impact of x on y. That is not what we would like to see, but it might happen. The preference is a positive or a negative relationship. In our example we would like to see that motivation has an impact on study results. So b should have a positive value and hopefully not equal zero or have a negative value.
And now we know b, it is easy to calculate a, with this formula:

Final remarks about univariate regression analysis
This is the basis of regression and it is called univariate regression. Keep in mind that this type of regression is an extension of product moment correlation, so it can only be conducted if you have variables measured at an interval or ratio level.
When a predictive variable is measured at a nominal level a type of analysis of variance (ANOVA or t-test) has to be used. However, dichotomies can be used in regression without any problem. Data on ordinal level are hard to use in regression analyses. Therefore I recommend not to operationalize your variables as measured at an ordinal scale if you want to use regression. When you are confronted with ordinal data try to figure out what they do when used as interval data in a regression, otherwise do a kind of ANOVA with these data.
When the dependent variable is a dichotomy or nominal, a kind of logistic regression has to be used.
Univariate regression has only two variables: an independent and a dependent one. If you have more than one independent variables, a form of multiple regression has to be performed.
Related topics to Regression analysis
- Multiple regression
- Hierarchical regression
- Mediation
- Moderation
- Correlation
- Variable
- Analysis of variance
Use our SPSS tutorials to learn how to run these tests in SPSS.


