Multiple correlation
The multiple correlation coefficient is an extension of Pearson's product moment correlation and reflects the relationship between two or more variables. The value is always between 0 and 1. The multiple correlation coefficient corresponds to the percentage of explanatory power.
To understand the multiple correlation, I start with the product moment correlation of Pearson. As you might know, this coefficient is the measure for coherence between two variables measured at an interval or ratio scale. The strength of the relationship can be calculated. Its value always lies between -1 and +1. Both values indicate a perfect relationship and result in a straight line. If the value of the relationship is exact 0, it indicates a perfectly non-relationship and the scatterplot will look like a football. If you make a scatterplot of the values between -1 to 0 and between 0 and +1 the scatterplot looks like a cigar. Values near 0 will look like a thick cigar and values near 1 look like a thin cigarillo. We produced some scatterplots in figure 1.

Now if you square the correlation coefficient, its value will always be positive. A value of zero means nothing can be explained about the Y-values based on the X-value, and a value of 1 means everything can be explained. The amount of explanation, can be shown in a Venn-diagram. If the correlation coefficient is 0, there will be no overlap at all between variable X and Y. If the correlation coefficient is 1, than there is a total overlap between the variables X and Y. Values between 0 and 1 will show a partly overlap.

Adding more variables
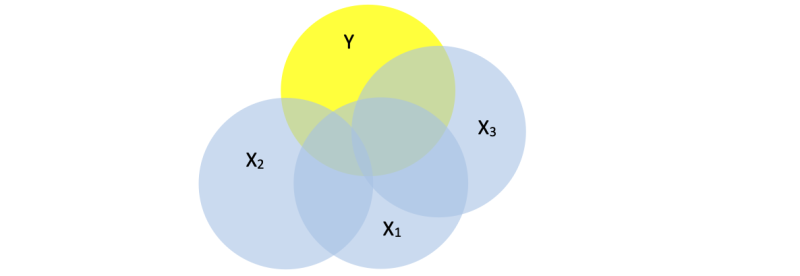
The situation with only one independent and one dependent variable, is rather simple. But with the Venn-diagrams in mind it is easier to understand what will happen if two or more independent variables overlap the dependent one.

The total overlap of Y with X1 and X2 is usually less than the overlap of X1 and Y or X2 and Y. The reason is the overlap between X1 and X2. Only when there is no overlap between X1 and X2 the sum will equal the total overlap with Y. The amount of overlap is called the explaining power, and this is reflected in the calculated R2, the multiple correlation coefficient.
It should be stressed that only positive values can occur because the single correlation is squared. Therefore the multiple correlation coefficient is notated as R2. To distinguish the multiple correlation coefficient from the single correlation coefficient it is written with a capital R.
If a third variable is added probably there is even more overlap of all X´s with Y. If the surface of Y is totally covered, then the variance of Y can complete be explained by the used X’s. In practice, this is never the case (unless you cheat or with too few cases and too many variables).

The goal in research is to find the variables (X’s) that explain the variance in the dependent variable (Y).
The change in R2
Adding variables will almost always lead to a higher R2. The extra overlap can be very small and not of interest at all. It also might be large and substantial. In science it is not allowed to make statements based on intuition. To test if the difference is substantial the difference between R2 in two situations is computed (noted as ΔR2), and tested with an F-test. If the outcome is statistically significant, you have a good argument to include the extra variable(s) to explain the variance in the dependent variable. Working this way, the effect of adding every single aspect (or a list of aspects) can be tested.
Suggestions for further reading:
- Univariate regression
- Multiple regression
- Hierarchical regression
- Mediation
- Moderation
- Correlation
- Partial correlation
- Variable
- F-test
All these tests are clearly explained in in our SPSS-tutorials.


