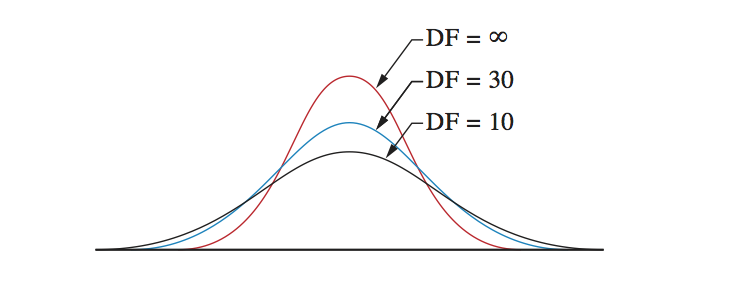
t-distribution
The t-distribution is a density distribution that looks similar to the standard normal distribution, however the shape depends on the degrees of freedom.
The best way to explain a t-distribution is by showing it. As you can see in this picture, the top is in the middle and toward both extremes the distribution becomes less. In theory the extremes go to infinite so the bell shape never ends. The shape of the bell depends on the degrees of freedom. With only a few degrees of freedom the shape is rather flat. With an increasing number of degrees of freedom the bell-shape becomes more high. With an infinite degrees of freedom the shape is equal to the shape of the standard normal distribution.

The density of the t-distribution
The formula to calculate the density of a t-distribution is this one:

Don’t be afraid of this formula. It isn’t necessary to know any formulas to become a good statistician. It is not even necessary to make the calculations yourself. You should only understand the basics of this distribution to understand the arithmetic of statistics for t-tests better.
As you can see, a t-value is calculated. This value depends om the degrees of freedom (denoted with the Greek letter nu (v)).
How is the t-distribution used in statistics?
In statistics the t-distribution is used for computing chances. Like the standard normal distribution, you need to understand a few thing clearly. The total surface under the curve is 100%. The distribution is symmetric so the surface left to 0 is 50% and the surface right to 0 is also 50%. Likewise the standard normal distribution, the 5%, 1% and 0.1% under a curve can be calculated. The calculations however are very hard. The values that are regularly used can be found in table in any (good) textbook about statistics. Such a table can be made in Excel too. You can download our Excel-file with the critical values from the right side of this page.
How to use the table of the t-distribution
If you compute a t-value with a formula (and there are quite some statistical test for computing a t-value), you can compare this computed t-value with the critical t-value in the table. If the computed t-value exceeds the critical t-value it is said that the difference is statistically significant. This supports the statement that A is larger than B. Nothing more and nothing less.
Final comments
The t-distribution is one of the four distributions that are widely used in statistics. The others are the standard normal distribution, the chi square distribution and the F-distribution. The chi square distribution and the F-distribution are related to the t-distribution. We discuss these distributions elsewhere in this dictionary and how they relate to the t-distribution.
Related topics to the t-distribution:
Manuals that help you to significantly improve your research:
- How to find the correct statistical test
- The statistical test procedure
- How to present statistical results


