t-test (one sample - )
A one sample t-test is a test for comparing the mean of a variable with a standard score.
There are several t-tests. The most common is a t-test between the means of two groups, and even of this type there are two subtypes. This is often called a t-test groups. The t-test groups is explained on a separate page of this site.
Another well-known t-test is a test between the means of two characteristics. This is called a t-test pairs. This test is also explained on a separate page of the site.
Finally there is a t-test that tests if a computed mean (or value) differs from a standard. Very often authors refer to this test as a one sample t-test. This test is explained below.
The one sample t-test
This test is used for research questions like:
Is the performance of these schoolkids better than average? Do people earn more than € 2,000.- each month? Is the average temperature in this house over 68 degrees Fahrenheit?
To apply the test you need to have one variable for which it is allowed to compute a mean. A mean can be computed for variables measured at an interval or ratio level. In our first research question this is the score for school performance. In the second example it is earnings. In the third example it is the temperature.
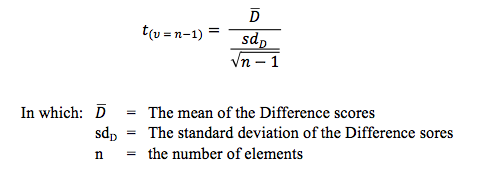
After detecting the right variables, the difference (D) between the scores of the elements in the sample and the compared standard value can be computed. This creates a new variable which we call D. Now the same procedure and the same test for a paired sample t-test can be used. If the mean of all D-scores is about 0, then there is no difference between the scores on this variable and the standard. That is: the schoolkids do not perform better, the people do not earn more than the standard and the temperature doesn’t deviate from the standard. However, when the deviations become bigger and in the same direction, the conclusion will be that the schoolkids perform better, the income is higher, the temperature is higher. To test if the difference is large enough this formula is used:

With this formula a t-value is computed. The degrees of freedom for this test are by definition the number of elements minus 1. And now the computed t-value can be compared with a critical t-value. The critical t-value can be found in a table in any good textbook about statistics (or in Excel). If the calculated t value exceeds the critical t-value, the difference is said to be statistically significant. If this is abracadabra to you, please read our paper about the statistical test procedure where this is explained in detail.
Usually it is okay to apply a one sample t-test if there are 30 cases or more and if it is allowed to calculate a mean for that variable.
Use our SPSS tutorials to learn how to run this test in SPSS.
Related topics to one sample t-test:
Manuals that help you to significantly improve your research:
- How to find the correct statistical test
- The statistical test procedure
- How to present statistical results


