- Adjusted R-square
- The adjusted multiple correlation coefficient is a correction of the multiple correlation coefficient based on the number of cases and the number of variables.
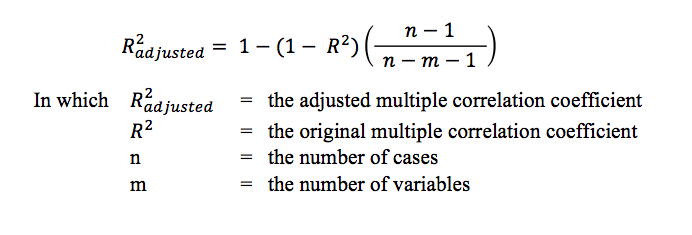
- This is the formula for computing the adjusted R2:
- How to interpret the adjusted multiple correlation coefficient
- Related topics in this dictionary:
- Mission

Adjusted R-square
The adjusted multiple correlation coefficient is a correction of the multiple correlation coefficient based on the number of cases and the number of variables.
In any statistical test you need to have a minimum number of cases. If there are to less, no statistical significance can be found, if there are too many, every analysis will be statistical significant. Most important is to find stable results. The outcome of a test should not be statistical significant now and then.
In regression the stability of the test can be inspected by computing the adjusted multiple correlation coefficient.
This is the formula for computing the adjusted R2:

As you can see, the adjusted multiple correlation coefficient is the original multiple correlation coefficient with a multiplication of the number of variables and the number of cases.
How to interpret the adjusted multiple correlation coefficient
Without doing any calculations these conclusions can be drawn:
1) If there are enough cases (n), the adjusted multiple correlation coefficient will not change a lot from the original. If the number of cases is endless it will not change at all. But if there are to less cases the adjusted multiple correlation coefficient will drop strongly.
2) If there are only a few variables (m), the adjusted multiple correlation coefficient will not change a lot from the original. Only in the impossible situation when no variables are used, no difference will be found. But if there are many variables the adjusted multiple correlation coefficient will drop strongly.
3) If you want to put a lot of variables in the regression analysis, a lot of cases are needed.
4) The maxixum value of the adjusted multiple correlation coefficient will always be less than 1.
5) The adjusted multiple correlation coefficient can get a negative value, which is quite remarkable for a squared value.
All these aspects don’t make the adjusted multiple correlation coefficient a stable and nice to interpret value. Therefore compare the value with the original. If there is only little change between the adjusted and the original value, the analysis is fairly ok. If the difference is large, the result of the regression analysis is rather unstable. And if the adjusted value is negative, then really watch out drawing conclusions. The last one is almost needles to say, because with a negative adjusted multiple correlation coefficient almost always no statistical significant regression coefficients will be found.
The adjusted R2 is used in regression. We explain where to find it in our SPSS-tutorials.


