Skewness
Skewness is an indicator for how far the mean is from the centre of the distribution.
Of Any list of numbers a mean can be computed. This mean can be exactly in the centre of the distribution. That is the case in the following list of numbers:

The mean of this distribution is 10 and the median is also 10. Because these values are equal, it is easy to state that the centre of this distribution lies in the middle. The frequency distribution look like this:
It is easy to make changes in the list of numbers above. For instance this:

The average of this distribution is 11.3 and the median is 12. Now these values differ and if a frequency distribution is made, it is easy to see that the distribution is not centered so well. Is this bad? And if so, what can be done about it?
How to compute the skewness
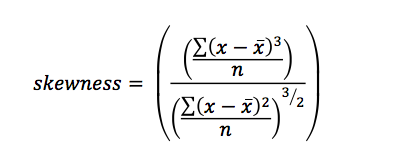
The question rises: is the distribution really off centre or can it still be seen as a centred distribution with equal legs on both sides? Because it is never permitted in science to make a statement without referral, this question must be tested. That is why skewness is calculated. To calculate skewness, enter this formula:

How to interpret the outcome
The result of this formula is zero if the centre of the distribution is exactly in the middle. It becomes negative when the centre shifts to the right and it becomes positive when the centre shifts to the left. And now notice, if the centre is on the left, the division is said to be right-skewed, and if the centre is right, the distribution is called left-skewed.

In theory, the outcome lies between minus endless and plus endless, but that is theory. You can keep the following in mind:
- Scores between -.50 and +.50 are said that the distribution is well centered.
- Scores between -1.00 and +1.00 are said to be almost well centered.
- Scores below -1.00 or above +1.00 are said not to be well centered.
What to do when the distribution isn’t well centered
The reasons why distributions are not well centered sometimes are caused by outliers. So check your data, and see if you can find these outliers and how they influence the outcomes of your statistics.
Continu to learn more about ...
Learn how tot analyze your data quick and easy with our SPSS tutorials.


