F-distribution
The F-distribution is a ratio distribution and created by dividing two positive numbers by each other.
The basis of the F-distribution
Suppose you want to compare two positive values. You can test that by dividing both numbers on each other. Because we do not yet know the outcome, we will just call him F. This can be shown in a formula:

If the result is 1, the numbers are exactly the same. If the number in the numerator (A) is greater than the number in the denominator (B), then the result is greater than 1. If the number in the numerator is smaller than in the denominator, the result is less than 1.
Because A and B are positive digits, the outcome can never get a negative value. The outcome cannot even be 0. So the minimal value of F is a limit to zero. On the other hand, A can become very large and B very small, so there is no maximum.
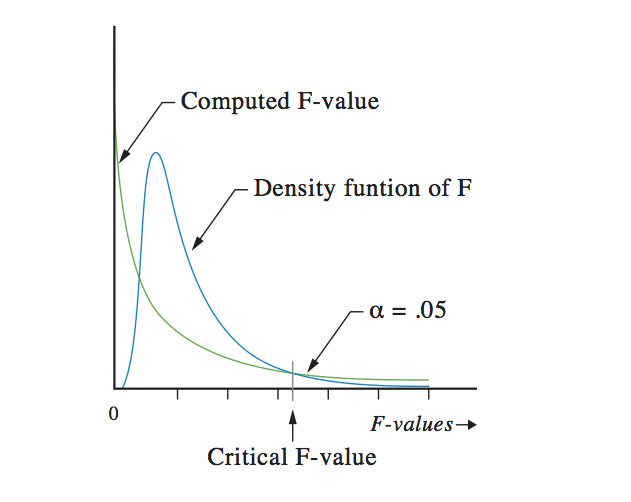
When making a density function, that is a function in which the chance of getting an outcome, the F-distribution will look like this:

Notice: 50% of the surface of the distribution is to the left of the outcome 1 and 50% of the surface is to the right. That is the reason why the left side is more high then the right side.
This figure looks quite the same as the chi-square distribution. There is only one distinction. The F-distribution has two degrees of freedom, one for the numerator and one for the denominator. That is why the results of an F-test in a statistical report always present two degrees of freedom.
As with all other density distributions changes can be calculated. Again the calculation are severe, so computer software has to do this job for us.
How to use the F-distribution
The F-distribution is used for situations in which a computed ratio value has to be compared with a theoretical ratio value, for instance in an ANOVA or in regression. The computed F-value is computed from the data you collected for your research. The critical F-value has to be computed from the above formula.
Nobody likes to do the computation all the time. Therefore, tables are used to find the critical value. Because in statistics only the covering of the surface for 95% (with alfa of 5%), the 99% (with alfa of 1%) and 99.9% (with alfa of 0.1%) are of interest, we only need to know these values. For the F-distribution this leads to a whole lot of digits. To present all these critical values in a pretty, nice looking table three tables are produced, one for alfa of .05 (5%), one for alfa of .01 (1%), and one for alfa of .001 (0.1%). Even good statistical textbooks need at least 3 pages filled with digits.
When presenting statistical test results, the critical values are never presented. So do not worry much about the exact values. Even the statistical software programs do not present them in their output. But if you want to know some values, you can download our Excel file with the critical F-values from the right side of this page.
Related topics to F-distribution
- Normal distribution
- t-distribution
- Chi square distribution
- Analysis of variance (ANOVA)
- Regression
- Degrees of freedom
- p-value
Manuals that help you to significantly improve your research:
- How to find the correct statistical test
- The statistical test procedure
- How to present statistical results


