- ANOVA (Analyses of variance)
- ANOVA is a statistical technique to determine whether the means of three or more groups deviate from each other.
- Examples of research questions for an ANOVA
- The calculations in an ANOVA
- The statistical hypotheses of an ANOVA
- Requirements for conducting an ANOVA
- Related topics to ANOVA:
- Read these manuals to learn how to use statistics:
- Mission

ANOVA (Analyses of variance)
ANOVA is a statistical technique to determine whether the means of three or more groups deviate from each other.
Quite a lot has to be explained to understand ANOVA in detail. Below a short outline can be found in which the essence of the ANOVA-test is explained.
Examples of research questions for an ANOVA
The ANOVA is applied with research questions like:
- Differ blackbirds, starlings and seagulls in size?
- Do people in Italy, the United Kingdom, Germany and Spain earn different amounts of money for the same type of work?
- Is there a difference between, Africa, America, Asia, Australia and Europe in the amount of waste that they produce?
The calculations in an ANOVA
ANOVA is short for analysis of variances. Now this looks weird at first sight, because the test is comparing means and not comparing variances of variables. Well, not the means itself are analyzed, but the variance between the means.
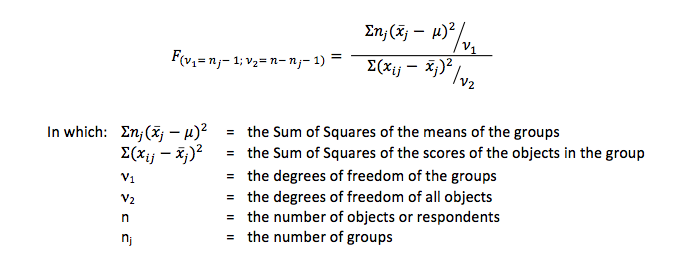
In essence it is the ratio between the variance between the means (the groups) and the variance within the groups. In formula this test is used:

The difference between the means is the score above the line . Let's call that A. The diffence between the subjects is the score below the line. Let's call that B. The difference are squared, so A and B will always be positive. The formula above can be simplified into:

If the differences between the means increase, the F-value gets larger and on a certain point it will exceed a critical value (on the F-distribution). Then the means differ statistically significant from each other.
The statistical hypotheses of an ANOVA
In essence this statistical hypothesis is tested:
H0: μ1 = μ2 = μ3 = ……
Ha: μ1 = μ2 = μ3 = ……
Again, when the means are almost equal, the variance between the means is low, that is near to zero. If so, the groups are said to be equal. When the means differ substantially, the variance between the means will be large. If so, the groups are said to be different (on the feature examined).
Requirements for conducting an ANOVA
Characteristic for an ANOVA is the comparison of the mean of three or more groups. A mean can only be calculated from continuous data, that is, from data measured at an interval or ratio scale. The number of groups is a variable measured at a nominal scale.
The number of groups (the independent variable) should be at least three. If there are only two groups a t-test should be performed. The dependent variable should be a continuous variable. If it is measured on ordinal level, it is better to perform a Kruskal-Wallis test, and if the dependent variable is measured on nominal level it is better to perform a chi square test. Read more about this topic in our paper which test should be performed?
In SPSS an ANOVA can be done on 3 ways. We clearly explain the use of all ways in our SPSS-tutorials.


