- Chi square distribution
- The chi-square distribution is the squared t-distribution. Because it is squared no negative values can occur. The distribution runs from 0 to +infinity.
- The chi-square distribution looks like this:
- How is the chi-square distribution used in statistics?
- Related topics to chi-square distribution:
- Mission

Chi square distribution
The chi-square distribution is the squared t-distribution. Because it is squared no negative values can occur. The distribution runs from 0 to +infinity.
The chi-square distribution is a theoretical distribution. It is used for situations in which a computed value has to be compared with a theoretical value. Because the outcome of the computed value can never be negative (a squared value is always positive), the t-distribution cannot be used. Now if you square the t-distribution, the chi-square distribution is created.
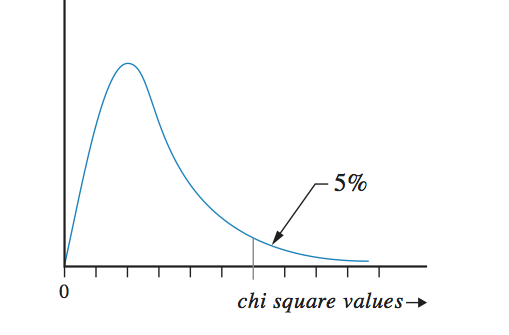
The chi-square distribution looks like this:

On the bottom line chi-square values are written. We didn’t write them here because the place in the figure depends on the degrees of freedom. We did place a line to show where the 95% surface of the distribution is covered. If in a statistical test the computed value crosses this border line, the test is statistical significant. Again it shows how simple statistics really are: just compute a value from your data and compare this value with a value in a theoretical distribution.
Though we presented one figure for the chi-square distribution, a lot of figures could have been presented. The shape of the distribution depends on the degrees of freedom. When the degrees of freedom are endless, the chi-square distribution will look like the normal distribution.
How is the chi-square distribution used in statistics?
Because so many distributions can be drawn, and nobody likes to do the computation all the time, tables are used. Because in statistics only the covering of the surface for 95% (with alfa of 5%), the 99% (with alfa of 1%) and 99.9% (with alfa of 0.1%) are of interest, we need to know only these values. The values depend on the degrees of freedom, so a table with only four columns will do. I presented the table with the first 10 values below.
The complete table can be found in any well statistical textbook. As a serve you can download the table here too.
Related topics to chi-square distribution:
Use our SPSS-tutorials to analyse your data. Research will become fun.


